Pixel Auditor Documentation
Debug your website's tracking pixels without touching developer tools. Open the side panel, browse your site, and see everything that's being tracked — what fires, where it goes, and what's broken.
Getting Started
Installation
Install Pixel Auditor from the Chrome Web Store, then pin it to your toolbar for easy access.
Basic Workflow
- Open the side panel — Click the Pixel Auditor icon in your Chrome toolbar, or right-click and select "Open side panel"
- Browse your site — Navigate through your website as you normally would. The extension captures tracking events automatically as you move from page to page.
- Check the Status tab first — This gives you an at-a-glance health overview. Green means OK, yellow means warnings, red means errors.
- Drill into specific issues — Use the Pixels, Activity, and Requests tabs to investigate anything flagged in Status.
How Data Persistence Works
All captured data — pixels, events, statuses — persists as you browse from page to page. Nothing disappears when you navigate. The extension keeps accumulating data across every page you visit so you can browse your entire site and build up a complete picture of what's firing and where.
Data is only cleared when you click the Clear button. The browser does not clear your data between page views, tab switches, or navigations. You stay in control.
The extension supports up to 1,000 pixel requests and 1,000 dataLayer events per tab. Use the Export button to copy all captured data as JSON before clearing.
The Four Tabs
Pixels Tab
Shows every tracking vendor detected on your site.
What you'll see:
- Vendor names and logos (GA4, Meta, LinkedIn, Google Ads, TikTok, Snapchat, Microsoft, Pinterest, Shopify)
- Account/property IDs for each vendor (Measurement ID, Pixel ID, Container ID, etc.)
- Click any ID to copy it to your clipboard
- Expandable "Locations" list showing which pages each pixel fired on and how many times
Use this tab to:
- Verify all expected vendors are present
- Confirm you're using the correct property/pixel IDs
- See which pages each vendor is active on
The Pixels tab shows detected vendors with their IDs. Click any ID to copy it.
On a complex site, you'll see multiple vendors with their respective measurement IDs, conversion IDs, and container IDs.
Status Tab
Your at-a-glance health dashboard.
What you'll see:
- Every vendor with event count, page count, and status (OK / warnings / errors)
- Google Consent Mode status showing whether
ad_storageandanalytics_storageare granted, denied, or pending - Expandable issue details per vendor showing exactly what went wrong
Issue types you may encounter:
- Missing parameters (required fields not included in events)
- PII leaks (plaintext emails, phone numbers, or unhashed personal data)
- No account ID (tracking request sent without a recognizable property/pixel ID)
- Failed requests (network errors or blocked requests)
"Copy & Debug with AI" button: Copies a plain-language diagnostic summary to your clipboard and opens Claude AI for step-by-step fix instructions.
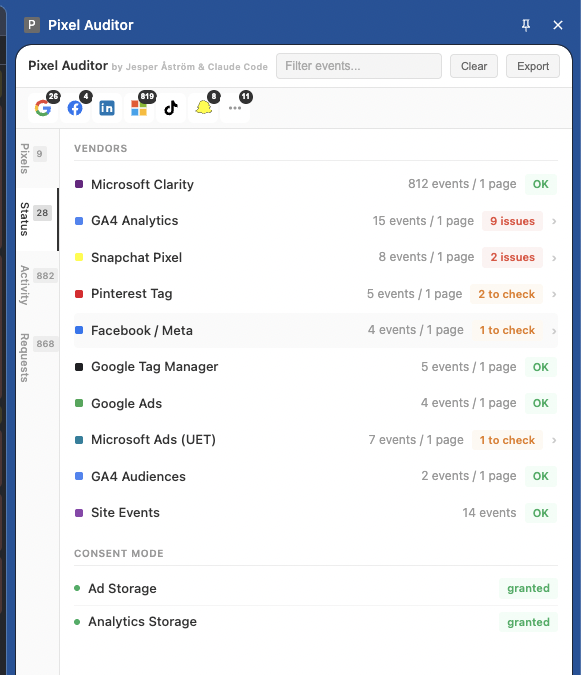
The Status tab gives you an instant health check. Green "OK" means no issues. Yellow/orange badges need attention. Consent Mode status appears at the bottom.
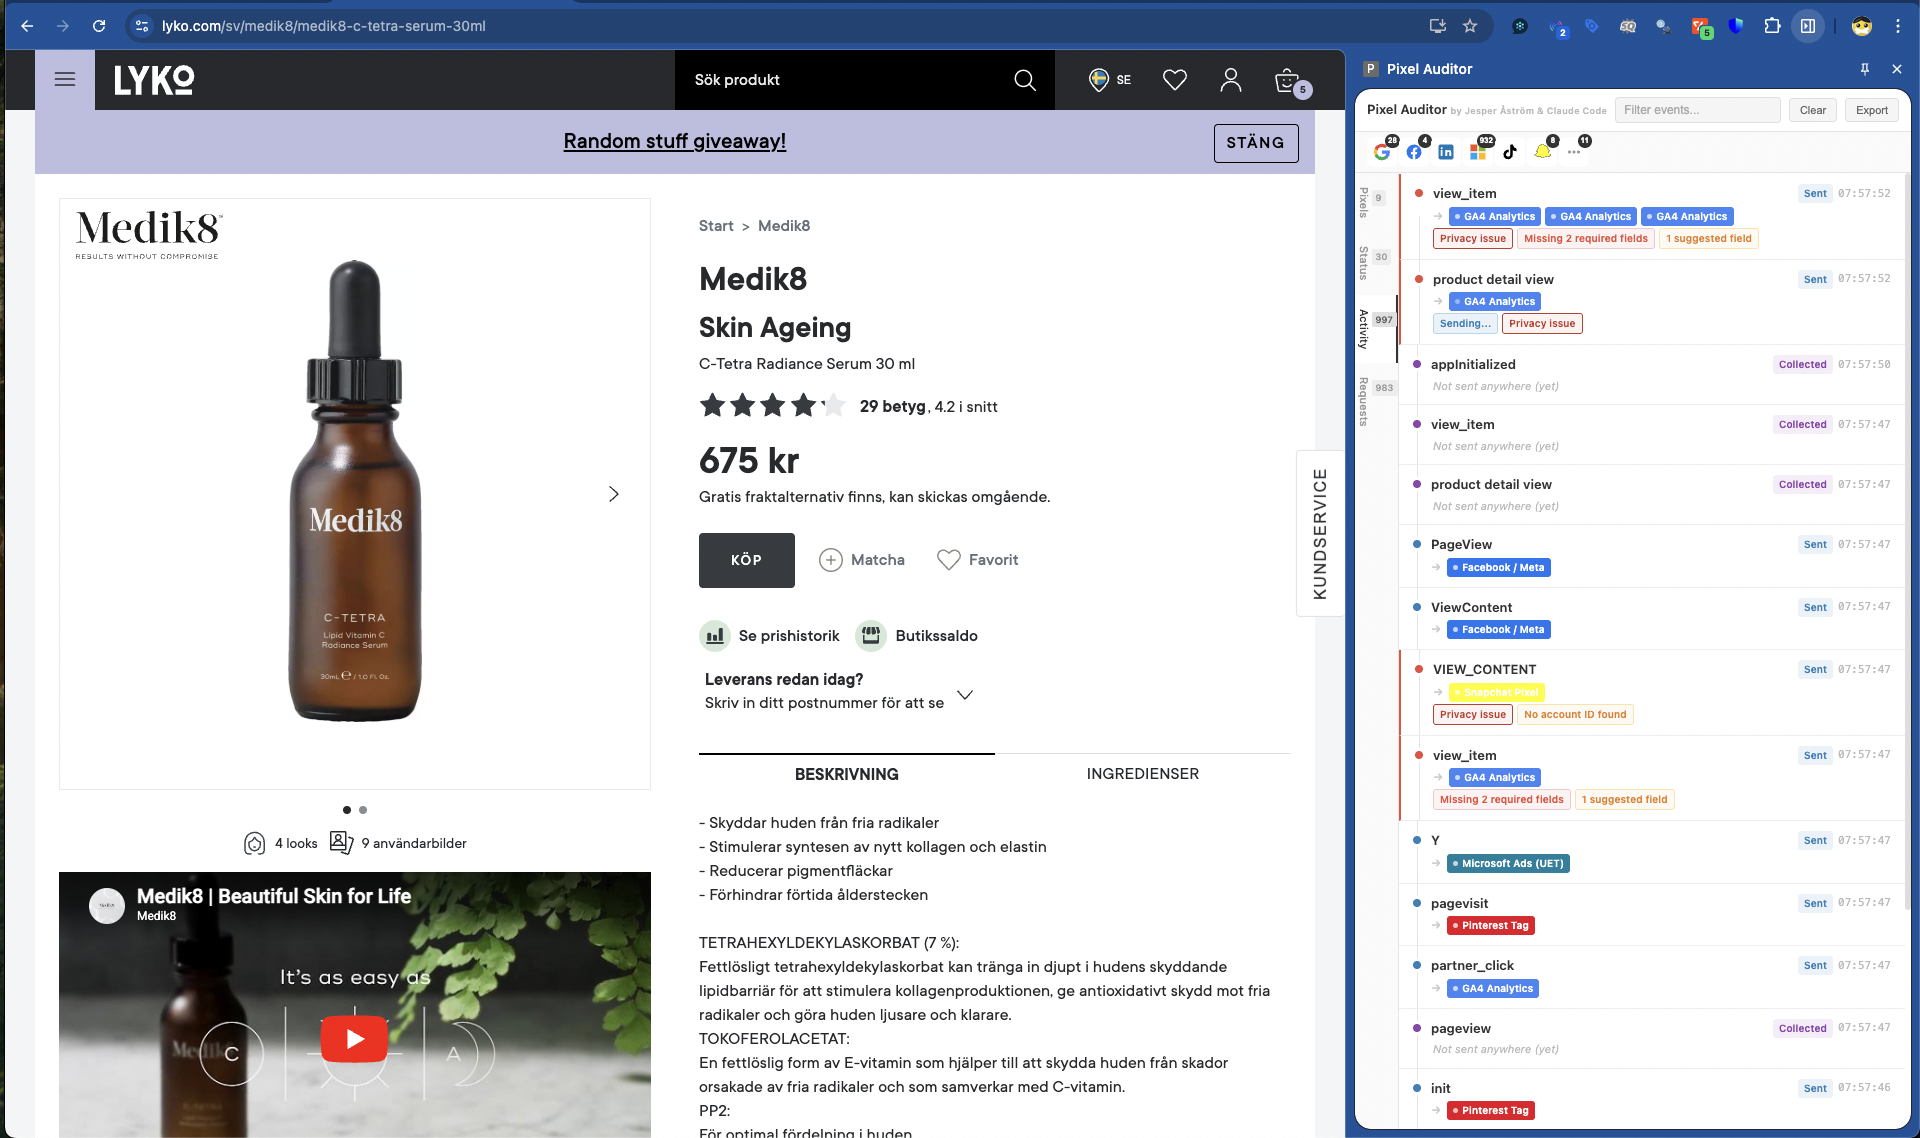
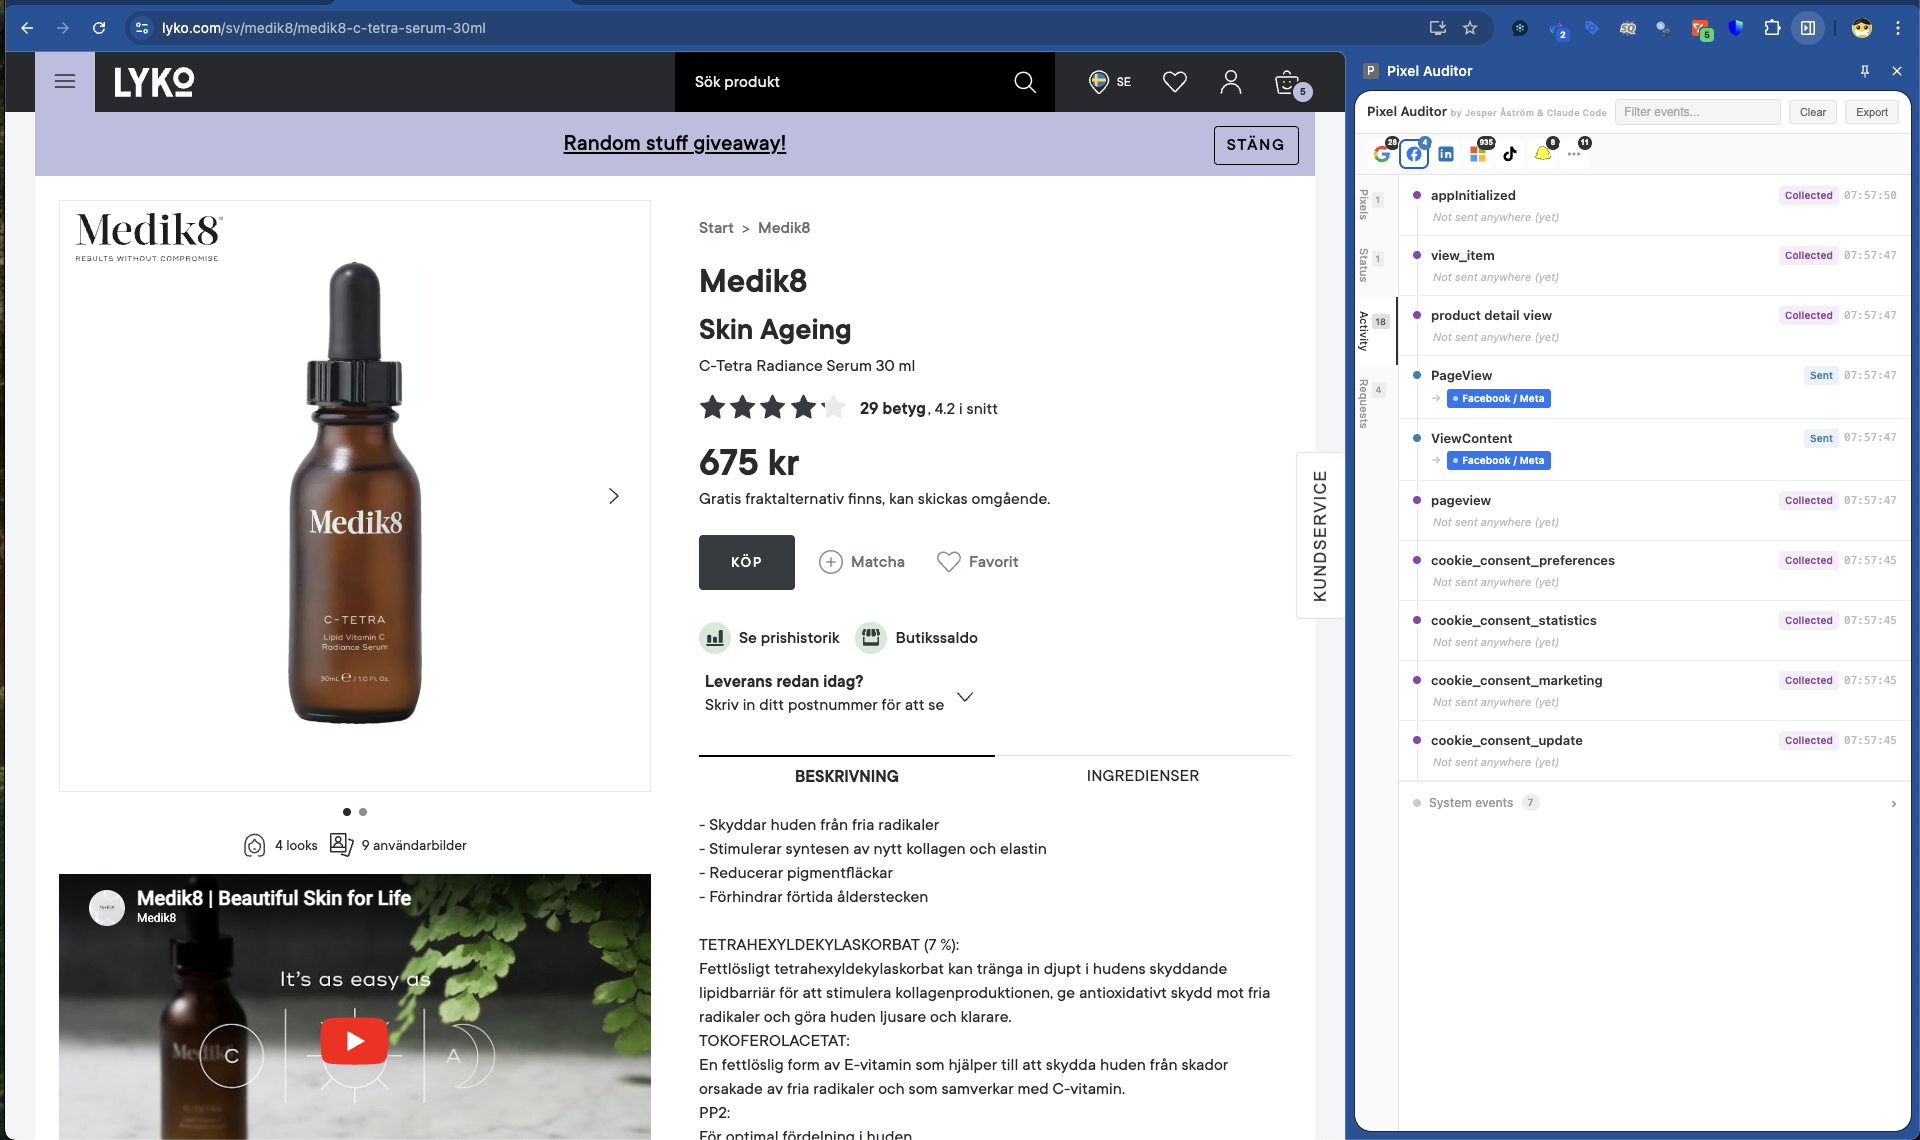
Activity Tab
A unified timeline of all tracking events in chronological order.
What you'll see:
- Connected-dot timeline design showing event flow
- Both dataLayer events ("Collected") and network requests ("Sent") in the same card
- "Sent" only appears once the event has actually been forwarded to a vendor
- Vendor destination pills with delivery status (success / pending / failed)
- Issue badges for PII, missing fields, consent restrictions, failed requests, missing account IDs
Flow matching: The extension automatically links a dataLayer.push()
to the network requests it triggered, showing the full journey from collection to delivery.
Expandable detail panel: Click any event to see the full dataLayer payload and request URLs.
"Ask AI to review" button: Opens Claude with the event data pre-loaded for analysis.
System events: Low-noise events like gtm.js, session_start,
user_engagement, and scroll are collapsed into a single expandable
"System events" group at the bottom.
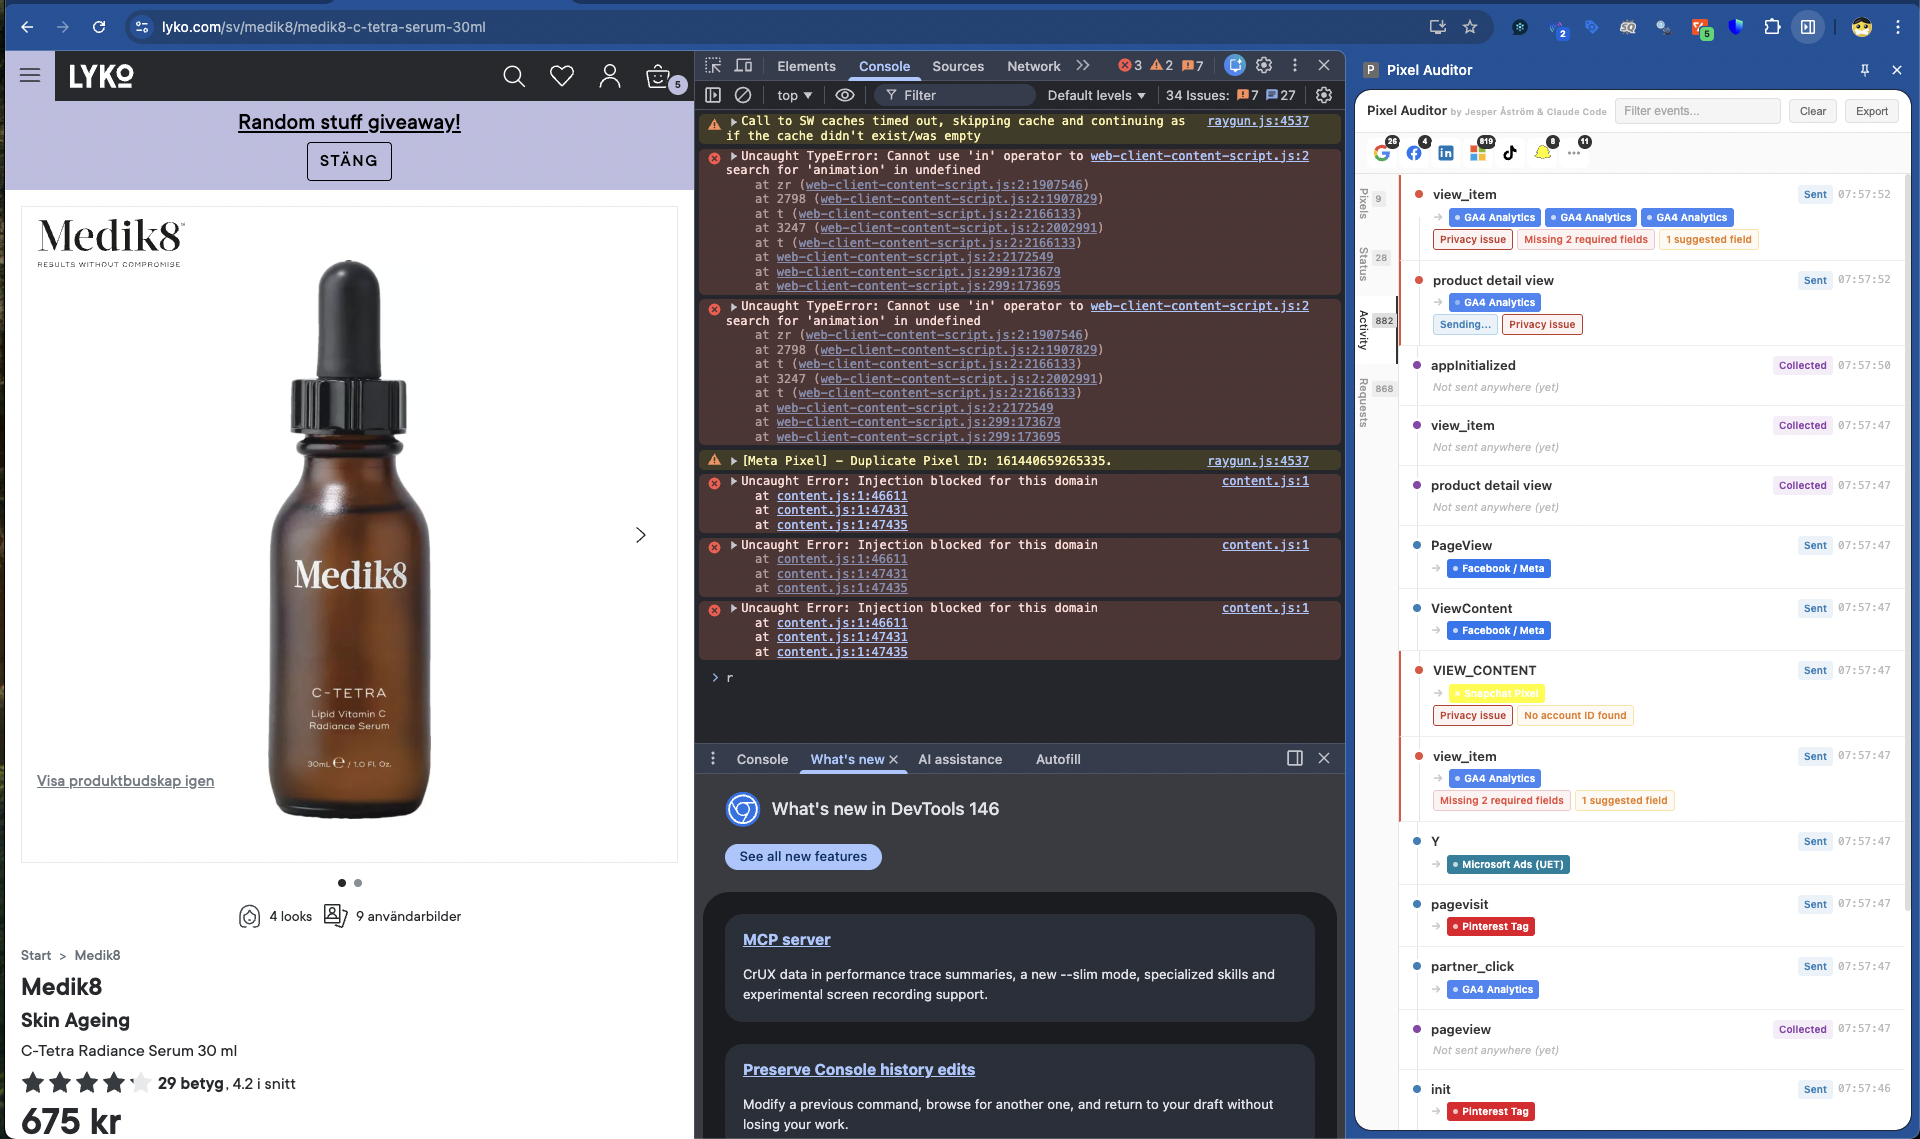
The Activity tab shows every event in chronological order. Red badges highlight problems — "Privacy Issue", "Missing required fields", and "No account ID found" flagged on specific events.
A cleaner view showing events that were collected and successfully sent to their destinations. The "System events" group at the bottom collapses noise.
On a simpler implementation, you'll see a clear flow of events firing to GA4.
Requests Tab
Raw network request view for deep debugging.
What you'll see:
- Requests grouped by vendor and account ID
- Full parameter decode with smart grouping: Event Info, Setup, Page Info, Visitor, Shopping Data, Consent Status
- Human-readable parameter labels (e.g.,
en→ "Event Name",tid→ "Property ID") - GA4 e-commerce event validation against official schemas
Available actions per request:
- Copy URL
- Copy params
- Ask AI to review
Search & Filtering
Search Box
The search box at the top filters across all tabs in real time. It matches against event names, request URLs, and parameter values.
Examples:
- Type "purchase" to find all purchase-related tracking
- Type "facebook" to narrow down to Meta pixel requests
- Type an email address to find PII leaks
Vendor Filter Bar
A row of clickable vendor logo icons appears below the search box: Google, Meta, LinkedIn, Microsoft, TikTok, Snapchat, Other.
- Badge counts show how many requests per vendor
- Click to filter all tabs to that vendor only
- Click again to clear the filter
Diagnostics & Validation
PII Detection
Every request is scanned for plaintext emails, phone numbers, and unhashed personal data.
Fields that should be SHA256-hashed (like em, ph, fn,
ln) are flagged if they contain raw values.
What to do when PII is detected:
- Identify the source — check the Activity tab to see which dataLayer event pushed the PII
- Fix your GTM tags or site code to hash personal data before sending
- For Meta CAPI events, ensure you're using SHA256 hashing for all user data fields
GA4 Schema Validation
The extension checks 17 standard e-commerce events against Google's official schemas:
purchase, add_to_cart, remove_from_cart,
begin_checkout, add_payment_info, add_shipping_info,
view_item, view_item_list, select_item,
view_cart, add_to_wishlist, view_promotion,
select_promotion, sign_up, login,
search, generate_lead
Validation levels:
- Required — Missing these parameters means the event won't work correctly in GA4 reports
- Recommended — Missing these parameters limits reporting capabilities but the event will still function
Consent Mode Decoding
The extension reads Google's gcs parameter to show whether tracking is running in full or restricted mode:
- Granted — Full tracking is active
- Denied — User declined consent; data collection is restricted
- Pending — Consent hasn't been determined yet
Request Status Tracking
Each pixel request shows its delivery status:
- Success — Request completed with HTTP 200
- Pending — Request is in progress
- Failed — Request returned an error or was blocked
Missing Account ID Warnings
When a vendor's tracking request doesn't contain a recognizable property/pixel ID, you'll see a warning. This usually means the pixel is misconfigured or firing before configuration is complete.
DataLayer Interception
The extension captures all tracking events pushed to the dataLayer, including:
- Standard
dataLayer.push()calls - GTM event triggers
gtag()function calls (Arguments objects, not just arrays)
Technical details:
- A polling fallback (400ms interval) catches events even after GTM overwrites the native push method
- Each event records the page URL via
window.location.hrefso you know exactly where it fired
Troubleshooting
"I don't see any pixels loading"
Possible causes:
- The side panel isn't active — Make sure you opened the side panel before navigating to your site. Events that fire before the panel opens won't be captured.
- Ad blockers are interfering — Disable ad blockers or add your site to the allowlist.
- No tracking is implemented — Check that your site actually has tracking pixels installed.
Fix: Open the side panel first, then navigate to your site. Try refreshing the page with the panel already open.
"Events show as Collected but not Sent"
This means the dataLayer received the event, but no network request was triggered.
Possible causes:
- Consent not granted — Check the Status tab for consent mode status.
- GTM trigger isn't configured — The event exists in the dataLayer but no GTM tag is listening for it.
- Tag firing rules not met — The GTM tag has conditions that aren't being satisfied.
Fix: Check your GTM container to ensure a tag is configured to fire on this event. Verify consent settings in your CMP.
"PII detected in request"
You're sending personal data in plaintext when it should be hashed.
Common sources:
- Form submissions that capture email/phone directly
- User login events that include raw user data
- Enhanced conversions configured without hashing
Fix:
- Identify the source event in the Activity tab
- Update your GTM tag or site code to SHA256-hash personal data before it reaches the dataLayer
- For Meta CAPI: hash
em,ph,fn,ln,ct,st,zp,country,db,gefields
"Missing required parameters on GA4 event"
Your e-commerce event is missing fields that GA4 needs for proper reporting.
Common missing fields:
transaction_idon purchase eventscurrencyon any event with monetary valuesitemsarray on product-related eventsitem_idoritem_namein items array
Fix: Update your dataLayer push or GTM tag to include the missing parameters.
"Request failed"
Possible causes:
- Network issues — Temporary connectivity problems
- Ad blocker — Request was blocked by browser extension
- CSP blocking — Your site's Content Security Policy is blocking the request
- Invalid endpoint — The tracking endpoint URL is incorrect
Fix: Check browser DevTools Network tab for the specific error. Disable ad blockers to test. Review your CSP headers if using them.
"No account ID detected"
Possible causes:
- Pixel firing before configuration — The tracking code is executing before the ID is set
- Misconfigured GTM variable — The property ID variable is empty or undefined
- Hardcoded ID removed — Someone deleted the ID from the tracking code
Fix: Check your GTM variables or hardcoded tracking snippets to ensure the property/pixel ID is present and loads before any events fire.
"I'm seeing duplicate events"
Possible causes:
- Multiple GTM containers — You have more than one GTM container on the page
- Multiple pixel implementations — Both GTM and hardcoded pixels are installed
- Tag firing multiple times — GTM trigger is configured to fire more than once
Fix: Audit your page source for duplicate tracking implementations. Check GTM for duplicate tags or overly broad triggers.
"Consent Mode shows Pending indefinitely"
Possible causes:
- CMP not initialized — Your consent management platform isn't loading properly
- Consent callback not firing — The CMP isn't communicating with GTM
- Missing default consent state — No default consent mode is configured
Fix: Verify your CMP is loading and initializing correctly. Check that your GTM container has a Consent Initialization trigger with default consent settings.
Supported Vendors
- Google Analytics 4 (GA4)
- Google Tag Manager (GTM)
- Google Ads
- Meta (Facebook) Pixel
- LinkedIn Insight Tag
- Microsoft Ads (UET)
- Microsoft Clarity
- TikTok Pixel
- Snapchat Pixel
- Pinterest Tag
- Shopify Tracker
Tips for Efficient Debugging
- Start with Status — Always check the Status tab first for the quickest overview of issues.
- Use search liberally — Type specific event names, transaction IDs, or user identifiers to filter down to exactly what you need.
- Export before clearing — If you're documenting issues or sharing with a team, export the JSON data before hitting Clear.
- Test the full funnel — Don't just check the homepage. Browse through product pages, add to cart, start checkout, and complete a test purchase to validate the entire tracking implementation.
- Use the AI review — When you're stuck, the "Ask AI to review" button provides specific guidance based on your actual event data.
- Check consent first — Many tracking "failures" are actually consent mode working correctly. Always verify consent status before assuming something is broken.
Built by Jesper Astrom & Claude Code (Opus 4.6)